Chapter 6 Interactive Geospatial Visualization
Figure 6.1: An example of leaflet() displaying the Eiffel Tower.
Figure 6.2: An example of addCircles() to include variables Lat and Long in the data frame.
Figure 6.3: An example of addPolygons() to draw the polygons objects.
Figure 6.4: Left: the geospatial object of the states in the US.
Figure 6.4: Right: the uniform polygons with default styling without any customization.
## Input to asJSON(keep_vec_names=TRUE) is a named vector. In a future version of jsonlite, this option will not be supported, and named vectors will be translated into arrays instead of objects. If you want JSON object output, please use a named list instead. See ?toJSON.Figure 6.5: Top left: the customized polygons with different colors and line of the state boundary.
## Input to asJSON(keep_vec_names=TRUE) is a named vector. In a future version of jsonlite, this option will not be supported, and named vectors will be translated into arrays instead of objects. If you want JSON object output, please use a named list instead. See ?toJSON.Figure 6.5: Right: the moused-over polygons with state names and information.
## Input to asJSON(keep_vec_names=TRUE) is a named vector. In a future version of jsonlite, this option will not be supported, and named vectors will be translated into arrays instead of objects. If you want JSON object output, please use a named list instead. See ?toJSON.Figure 6.5: Bottom: the moused-over polygons with state names and information, and the legend for the regions.
## Input to asJSON(keep_vec_names=TRUE) is a named vector. In a future version of jsonlite, this option will not be supported, and named vectors will be translated into arrays instead of objects. If you want JSON object output, please use a named list instead. See ?toJSON.
Figure 6.6: Examples of mapping variables to colors. Top left: colorNumeric().
## Input to asJSON(keep_vec_names=TRUE) is a named vector. In a future version of jsonlite, this option will not be supported, and named vectors will be translated into arrays instead of objects. If you want JSON object output, please use a named list instead. See ?toJSON.
Figure 6.6: Top right: colorQuantile().
## Input to asJSON(keep_vec_names=TRUE) is a named vector. In a future version of jsonlite, this option will not be supported, and named vectors will be translated into arrays instead of objects. If you want JSON object output, please use a named list instead. See ?toJSON.
Figure 6.6: Bottom left: colorBin().
## Input to asJSON(keep_vec_names=TRUE) is a named vector. In a future version of jsonlite, this option will not be supported, and named vectors will be translated into arrays instead of objects. If you want JSON object output, please use a named list instead. See ?toJSON.
Figure 6.6: Bottom right: colorFactor().
Figure 6.7: Two examples of the county-level map. Top panel: County-level map of COVID-19 infection risk on December 31, 2020.
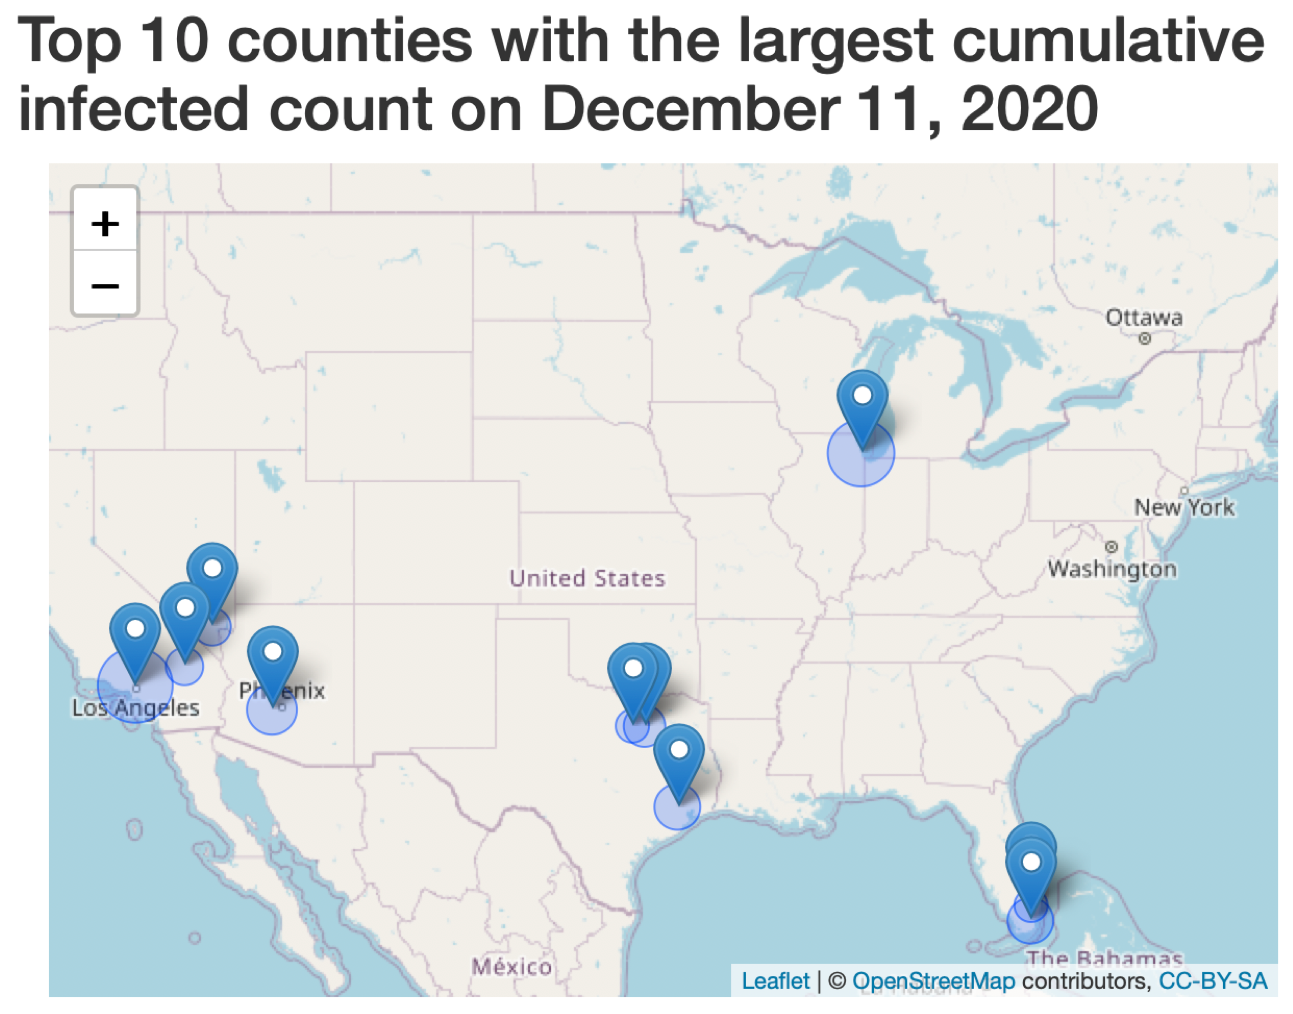
## Joining, by = "ID"Figure 6.8: Examples of spot maps. Top left: drawing a base map.
Figure 6.8: Top right: adding circles using addCircles().
Figure 6.8: Bottom left: adding popups using lapply(htmltools::HTML) and addMarkers().
Figure 6.8: Bottom right: adding labels using addMarkers().

Figure 6.9: The result of integrating leaflet with R Shiny.