Chapter 5 R Shiny

Figure 5.1: An illustration of Shiny structure.

Figure 5.2: The hello Shiny example. This example is hosted on https://shiny.rstudio.com/gallery/example-01-hello.html.
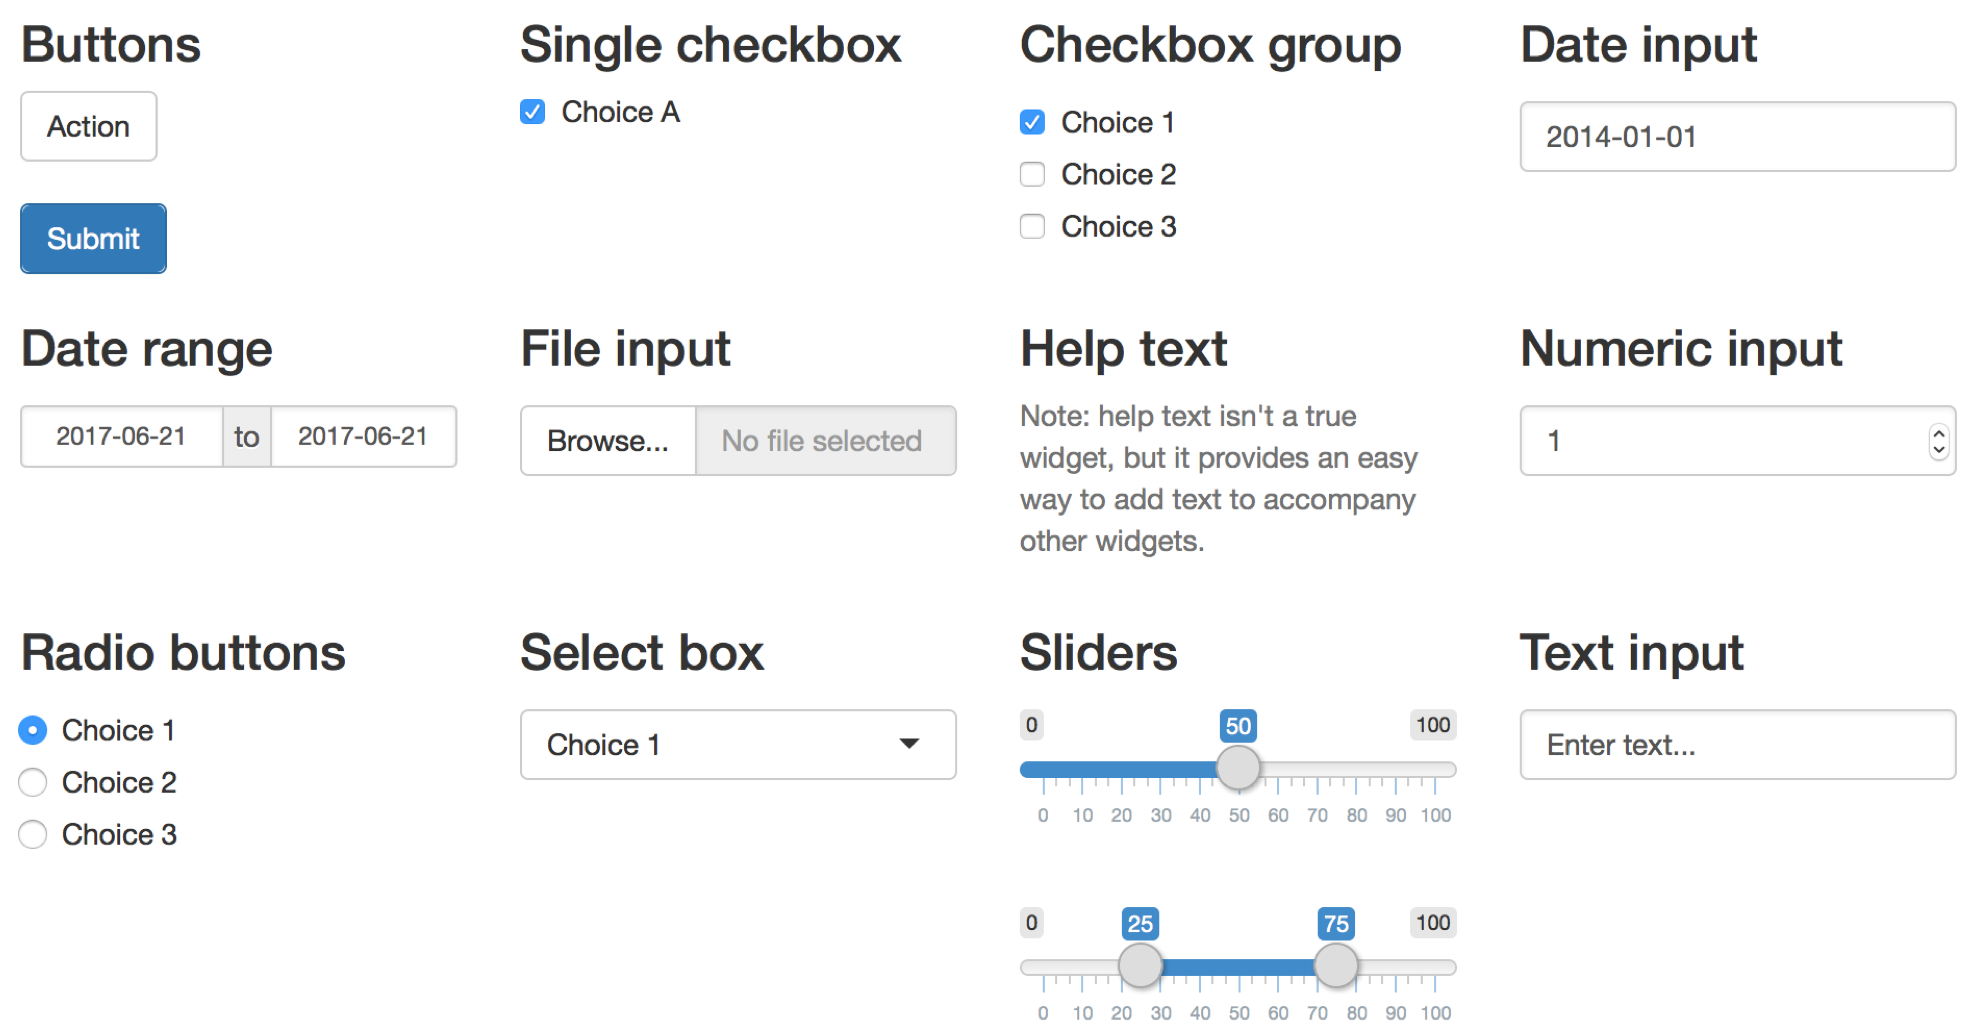
Figure 5.3: The basic input widgets. See the widgets section in https://shiny.rstudio.com/gallery/ for more examples.
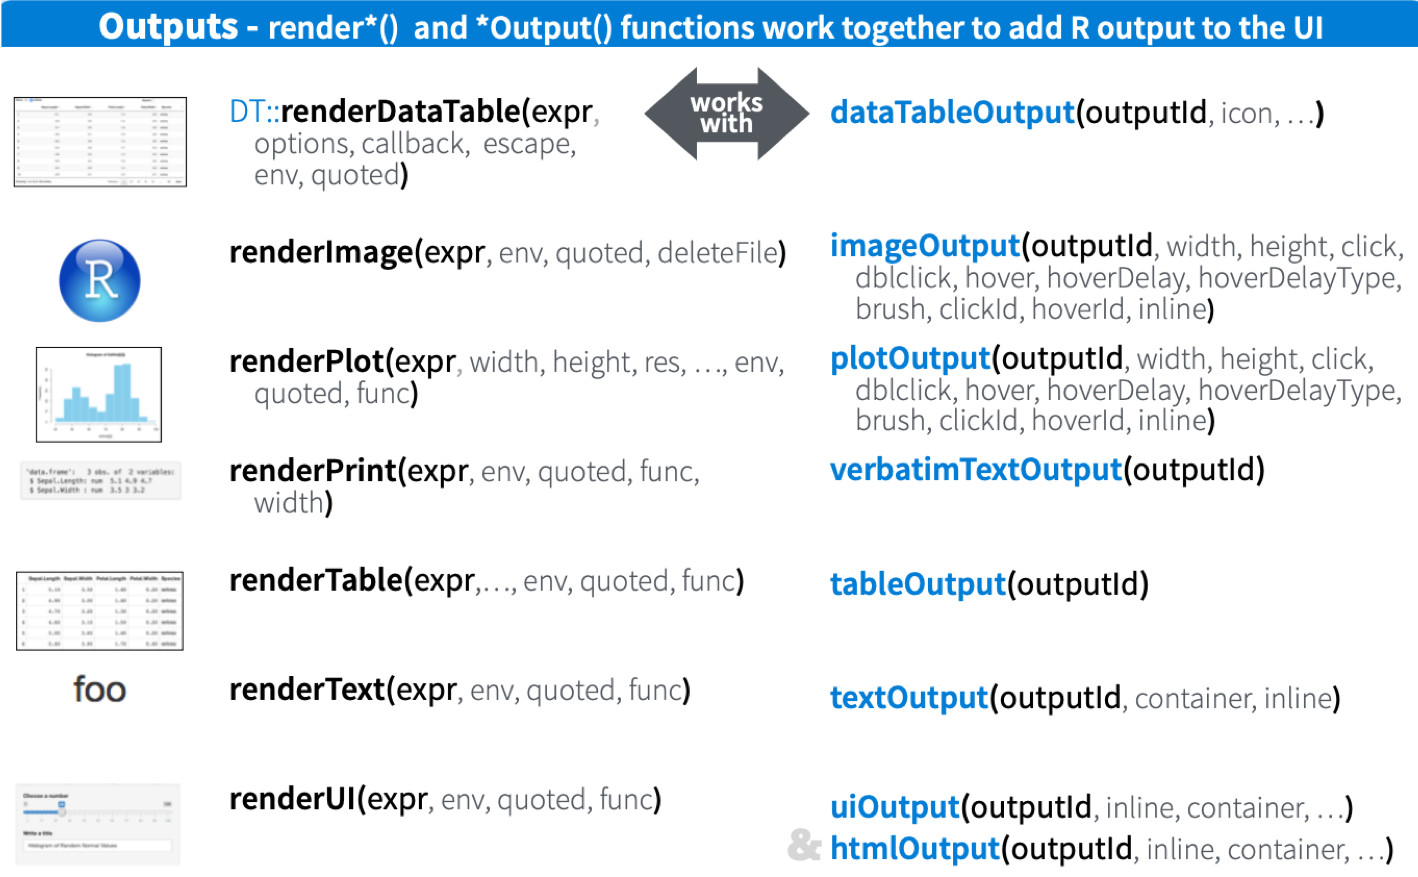
Figure 5.4: The basic output widgets. Source: https://shiny.rstudio.com/images/shiny-cheatsheet.pdf.
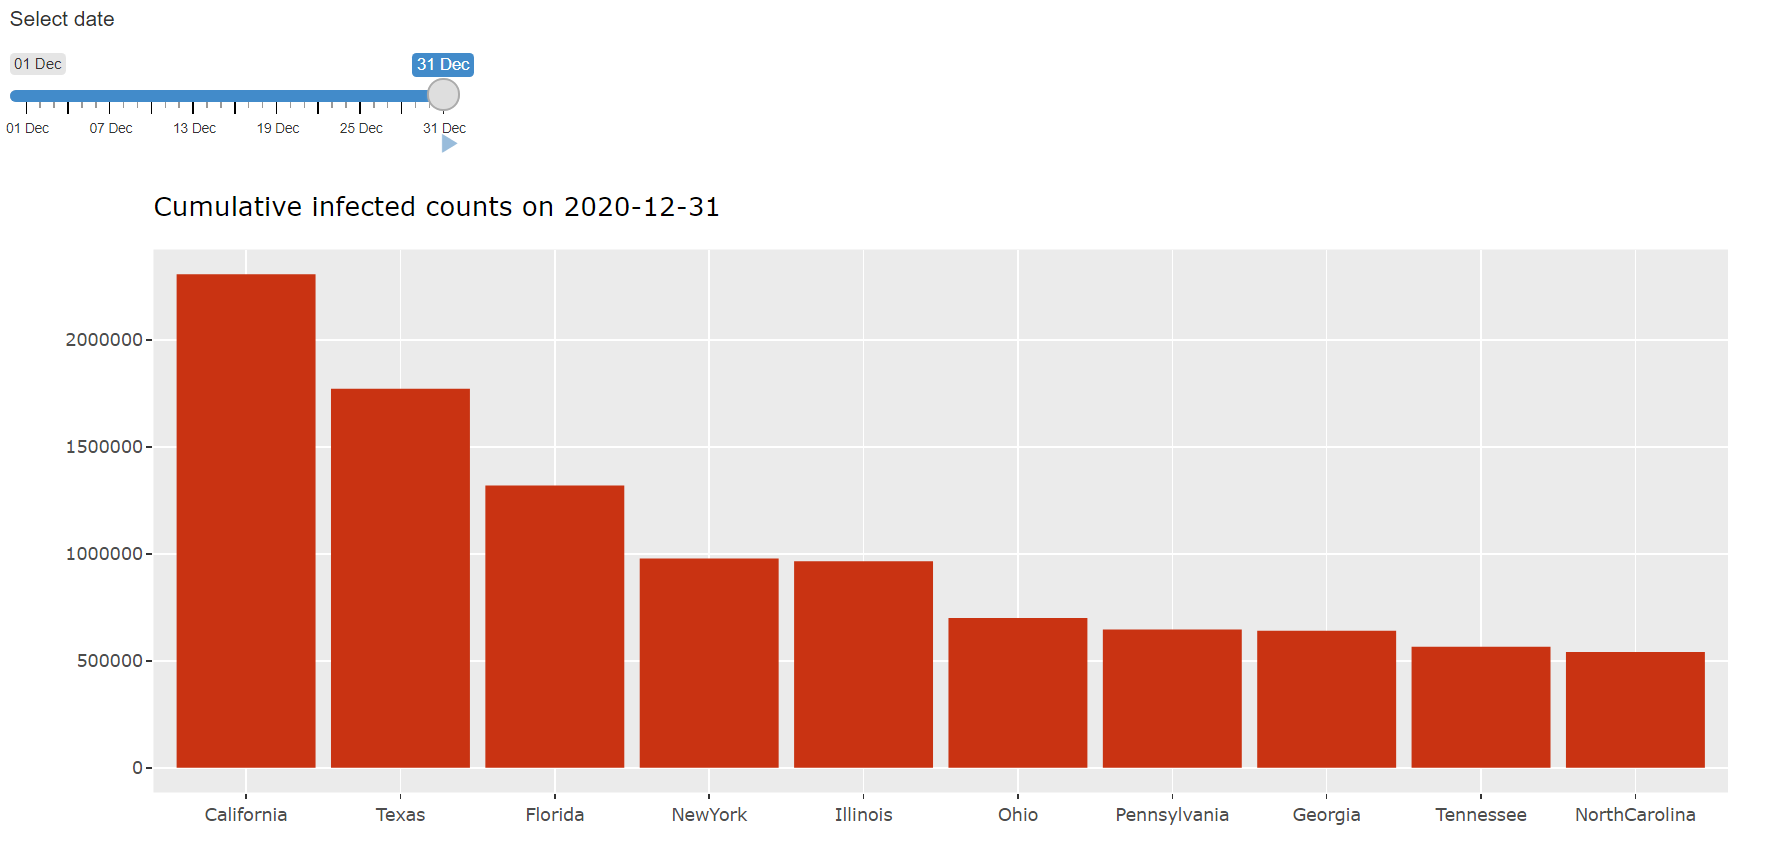
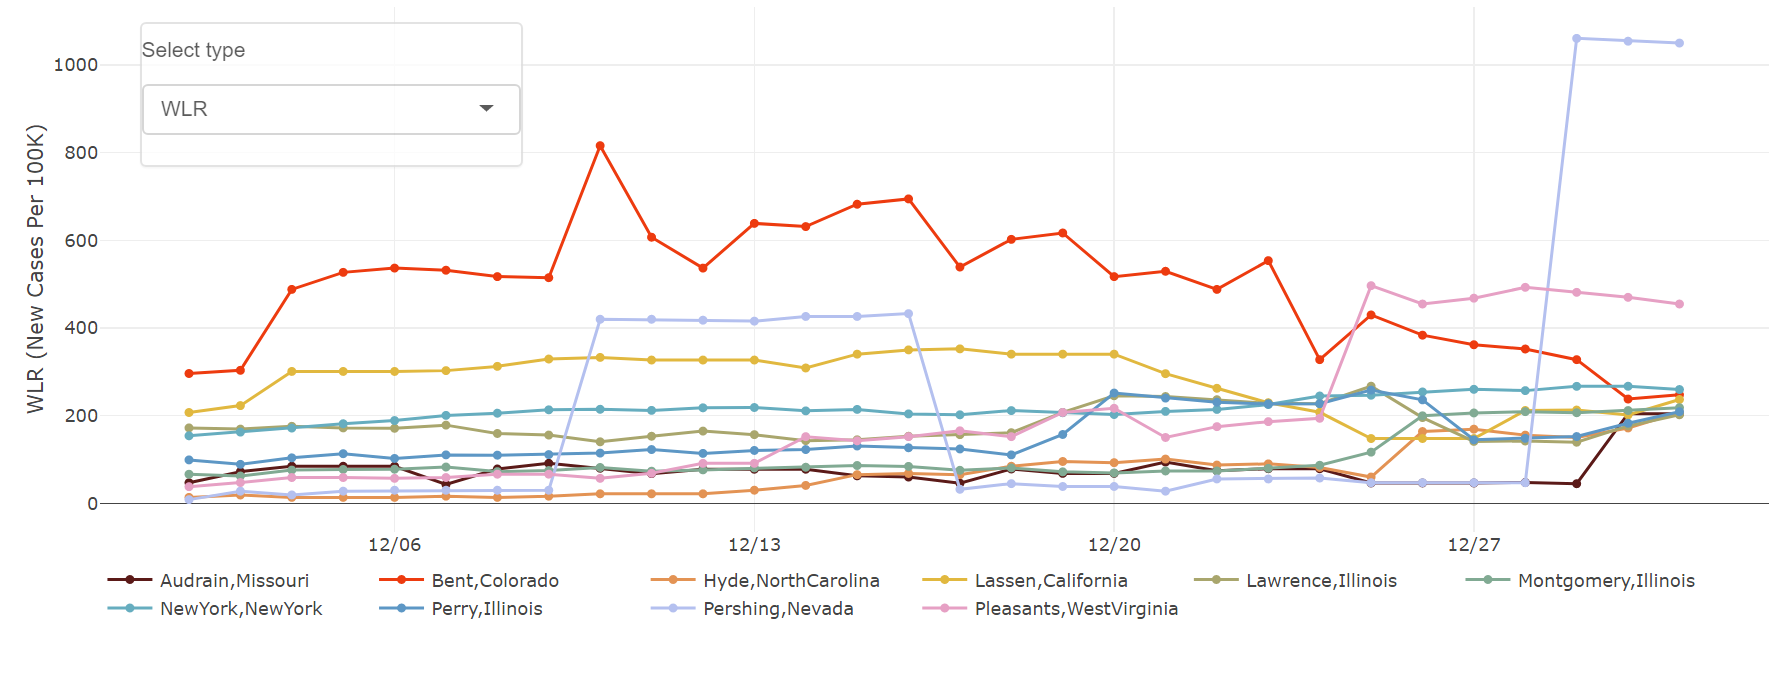
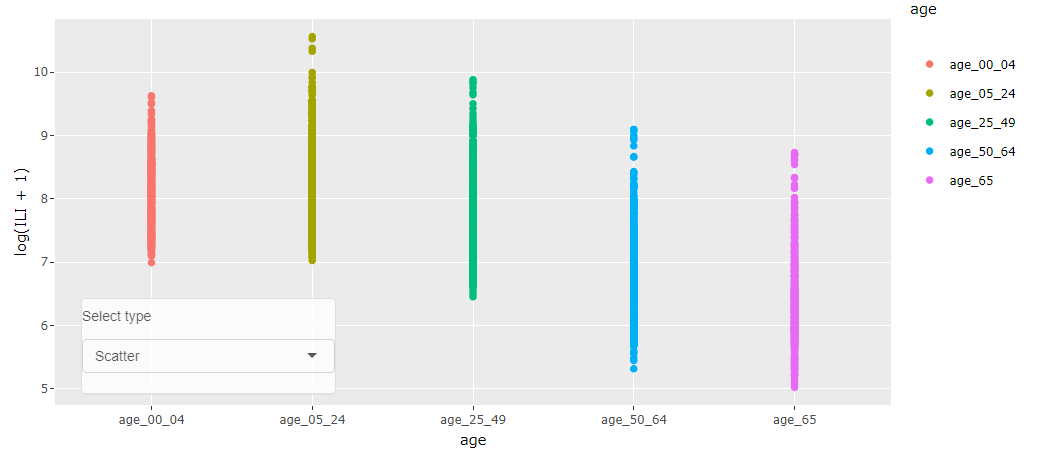
Figure 5.5: Bottom: various types of plots (scatter, jitter, box, and violin) for different age groups in the ILI data.