Chapter 1 Introduction
![Chain of infection. Source: Centers for Disease Control and Prevention [@dicker1992principles].](figures/infection.jpg)
Figure 1.1: Chain of infection. Source: Centers for Disease Control and Prevention (Dicker and Gathany 1992).

Figure 1.2: The stages of a data science workflow (original source: Kim et al. (2021)).


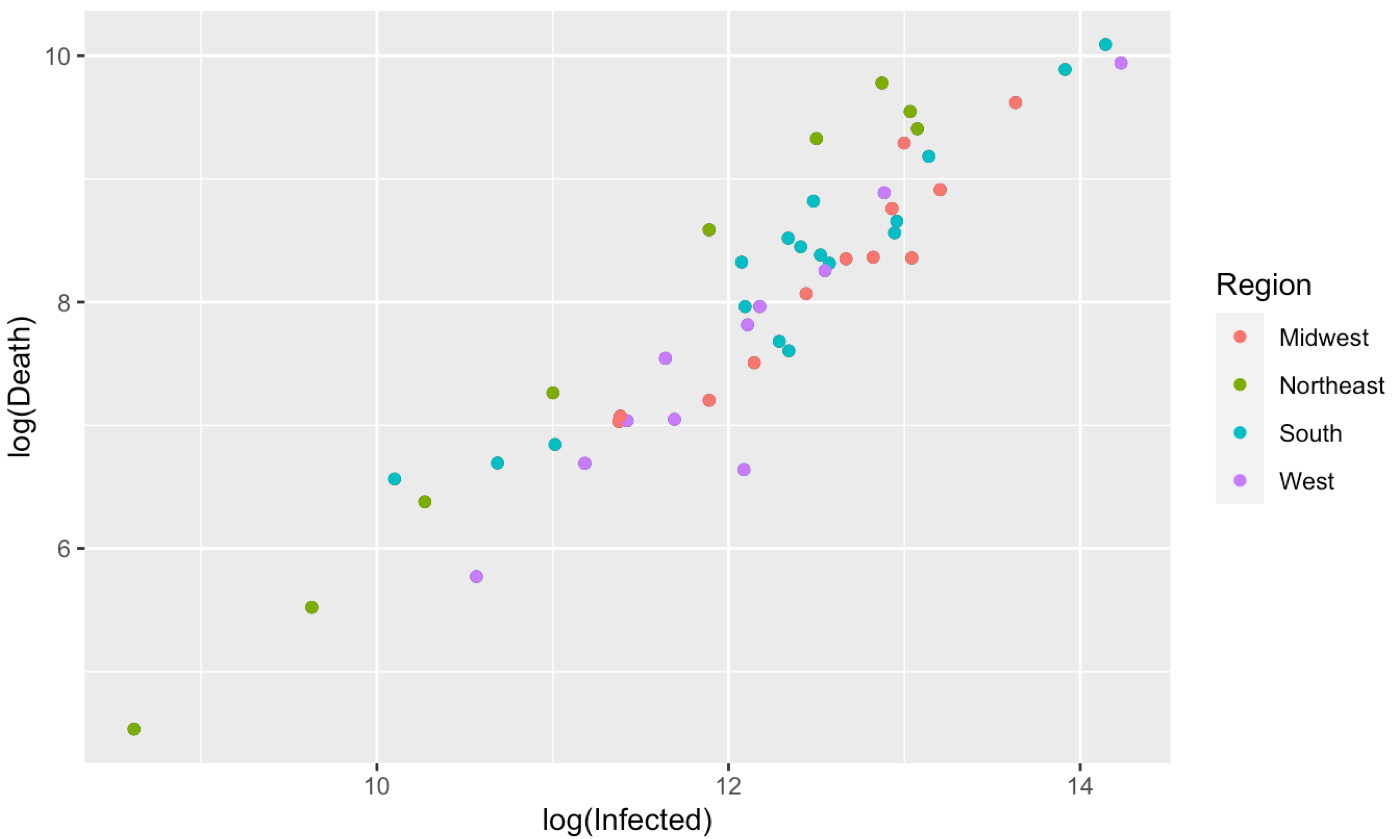
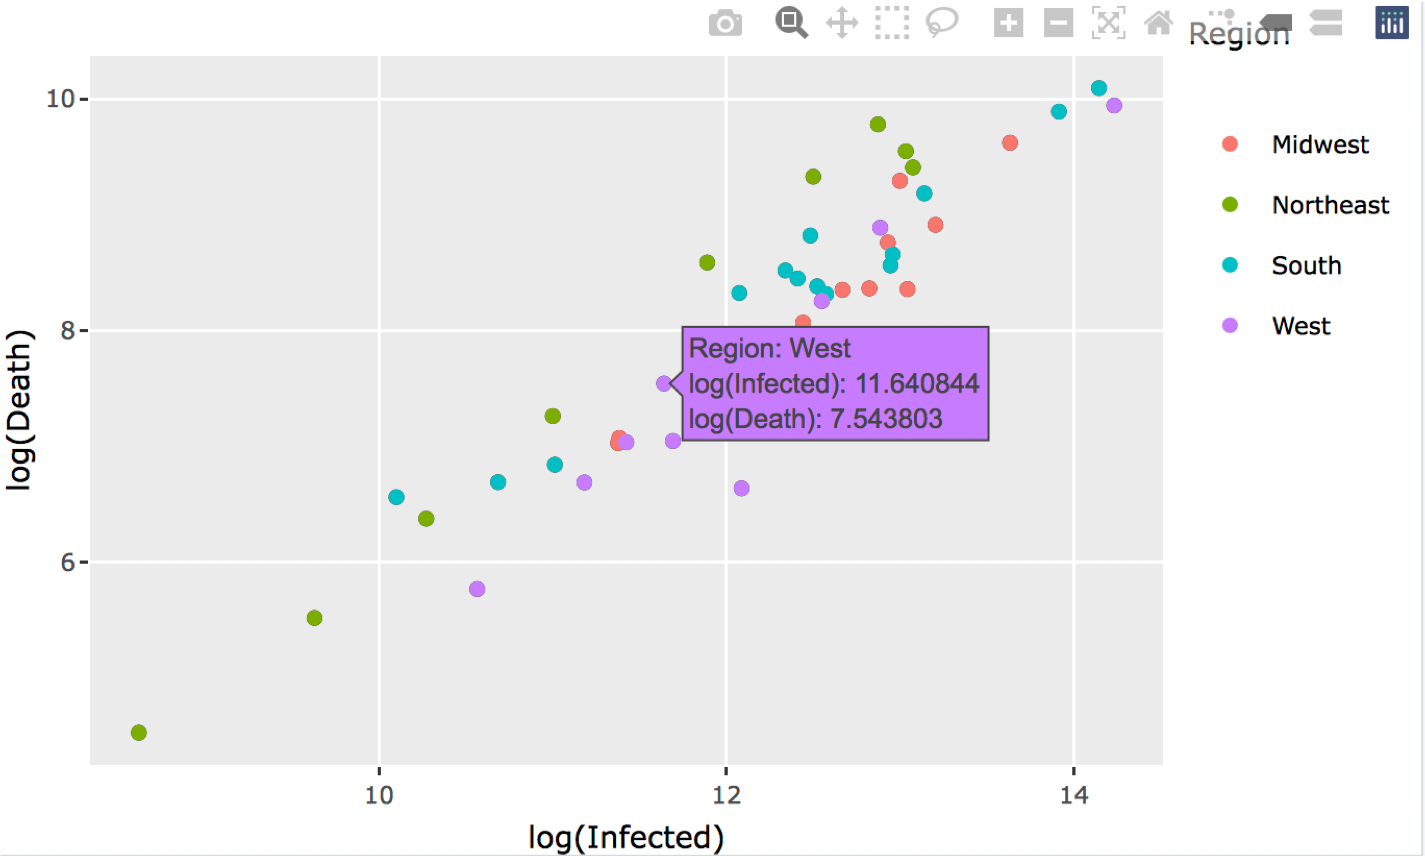
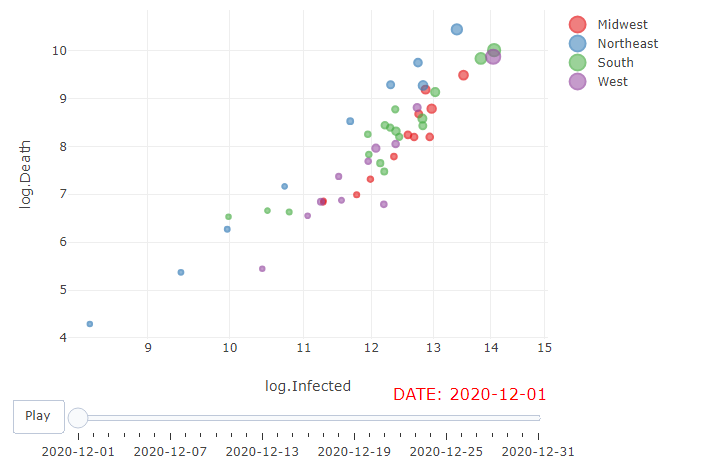
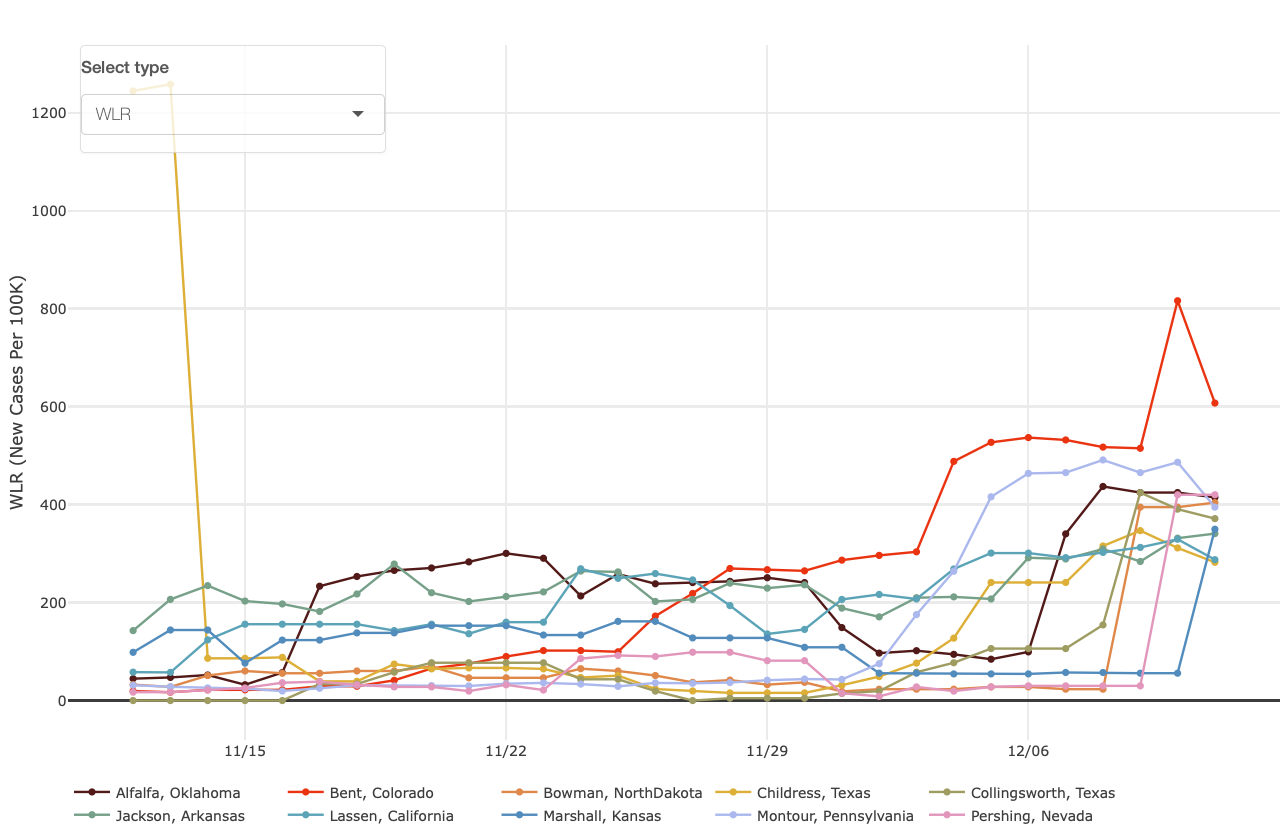
Figure 1.3: Types of visualization plots.
References
Dicker, R, and NC Gathany. 1992. “Principles of Epidemiology, 2nd Edn., US Department of Health and Human Services.” Public Health Service, Centre for Disease Control and Prevention (CDC), Atlanta.
Kim, Myungjin, Zhiling Gu, Shan Yu, Guannan Wang, and Li Wang. 2021. “Methods, Challenges, and Practical Issues of COVID-19 Projection: A Data Science Perspective.” Journal of Data Science 19 (2).