Chapter 12 Hybrid Models

Figure 12.1: An illustration of ensemble methods.

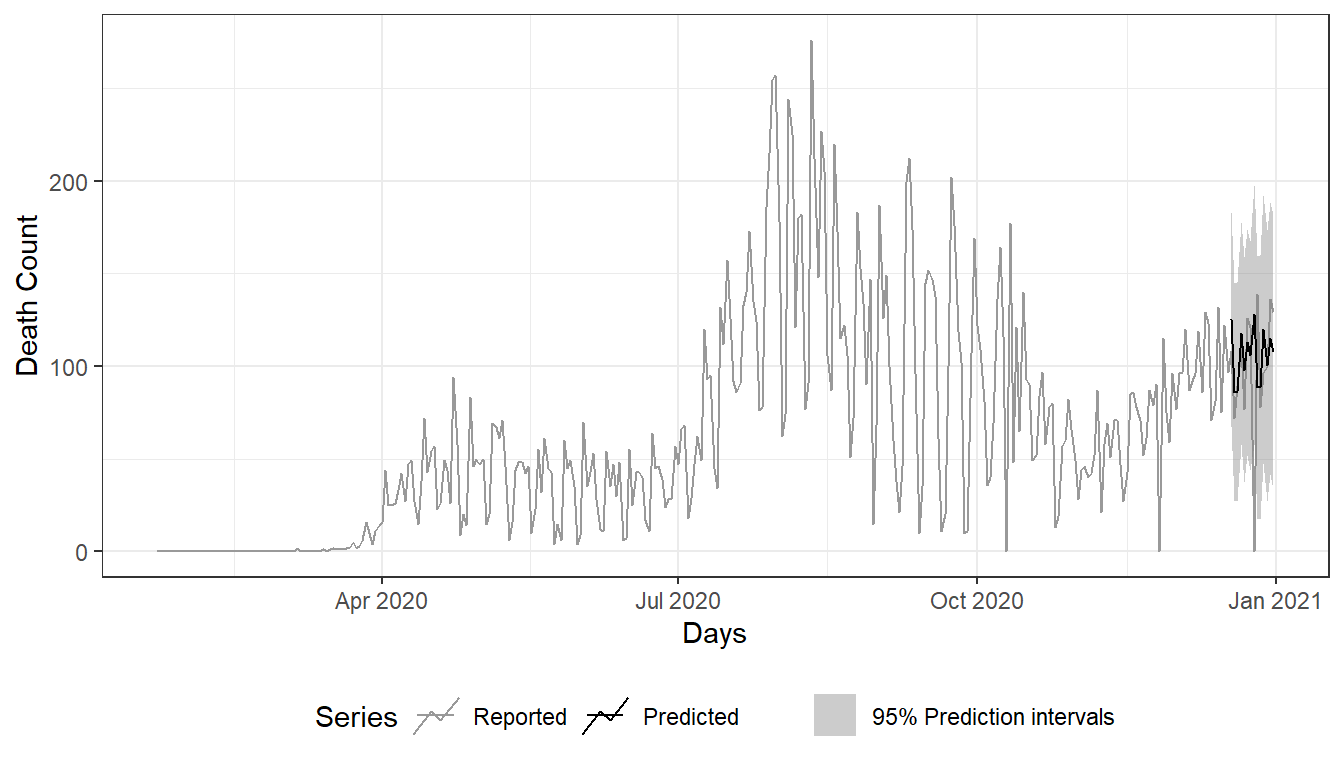
Figure 12.2: Combined forecast from different models.

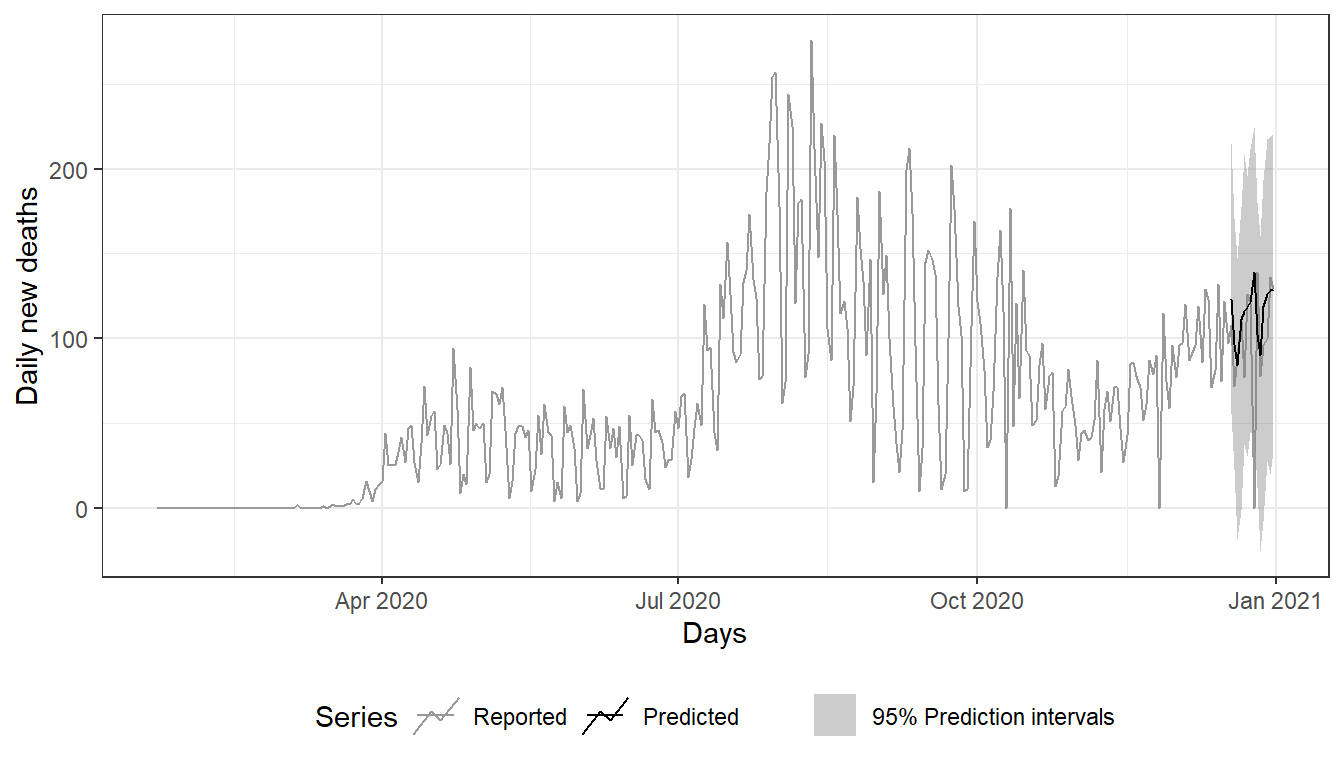
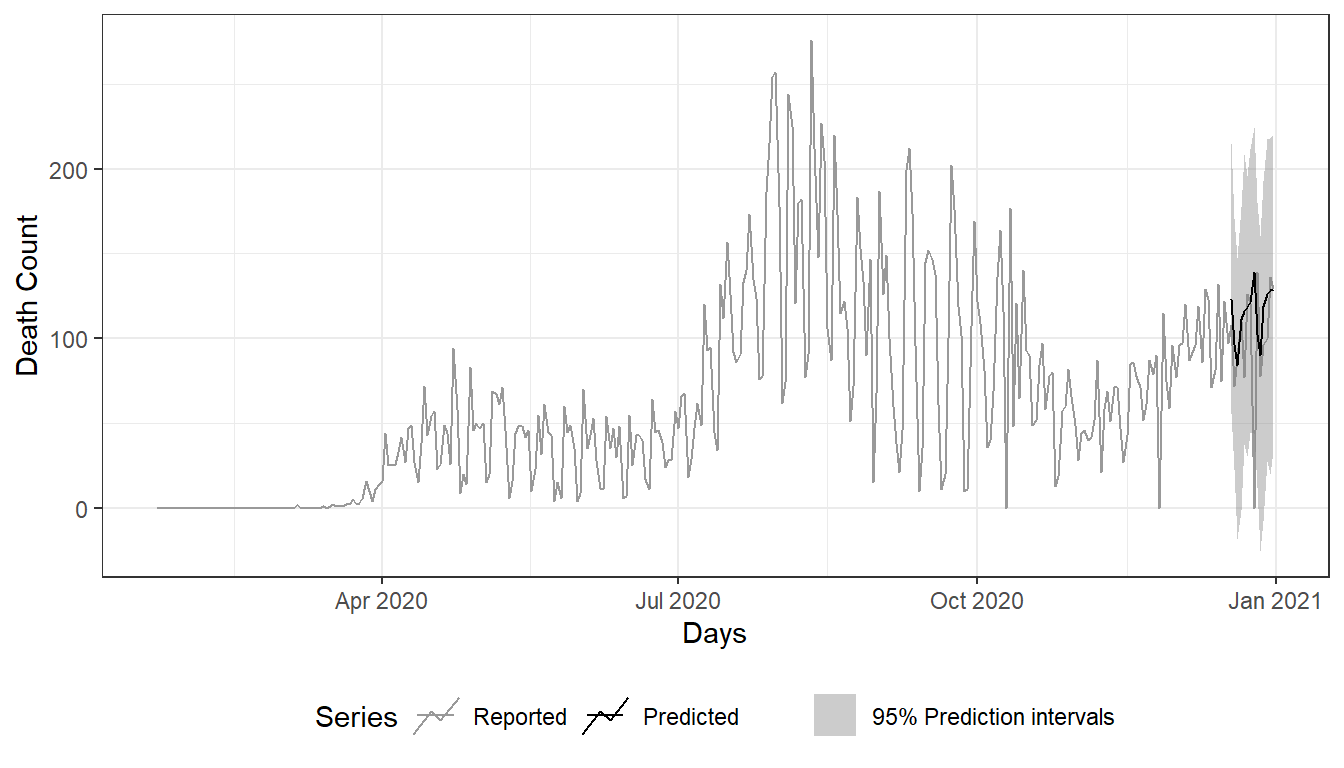
Figure 12.3: Forecast from auto.arima model.

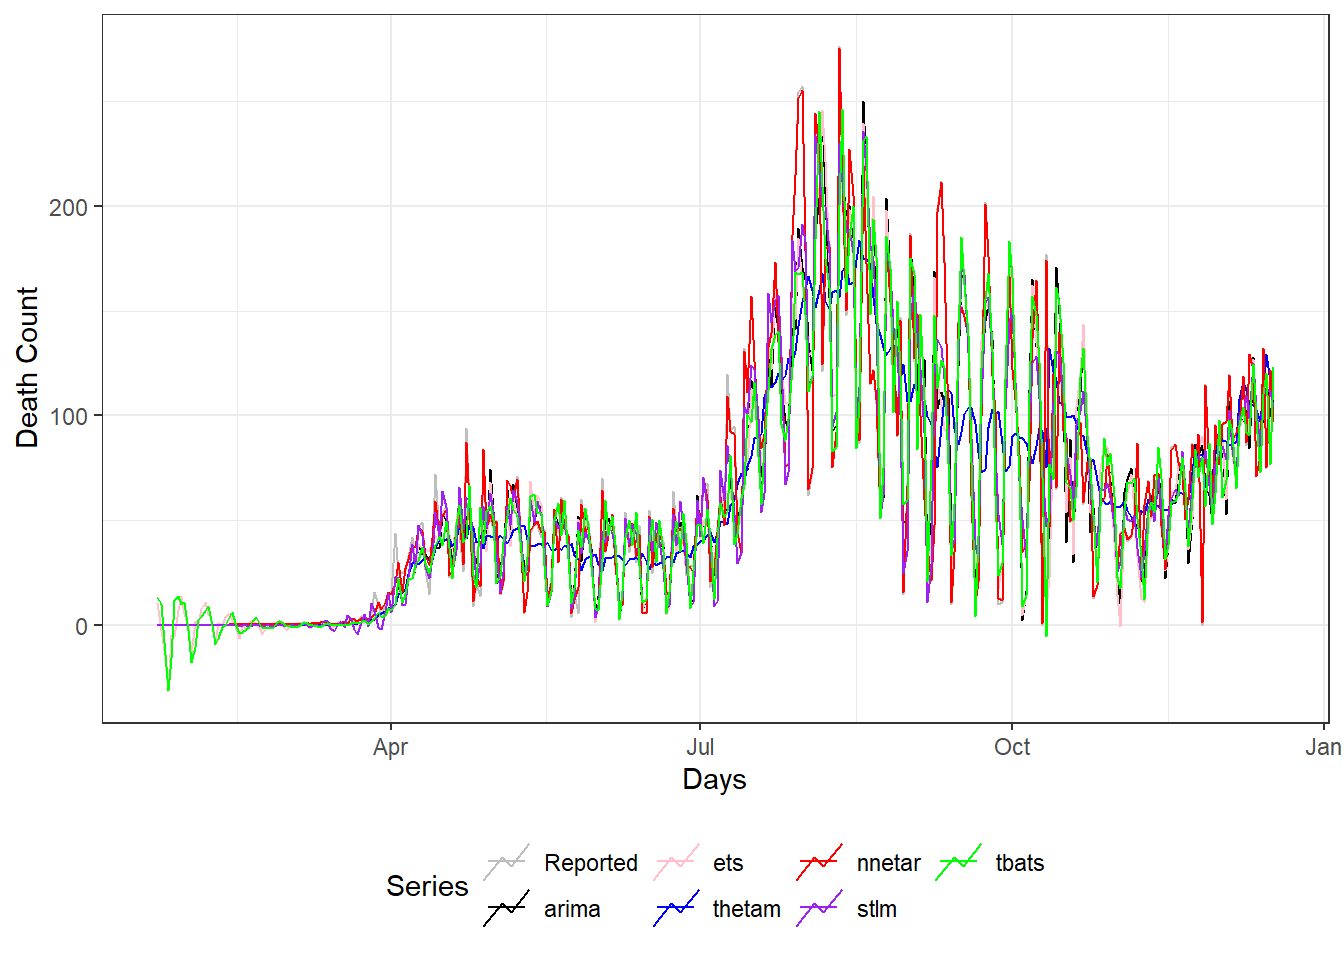
Figure 12.4: Actual and fitted values of each component model.

Figure 12.5: Two weeks ahead ensemble forecast from different methods.

Figure 12.6: Two weeks ahead ensemble forecast from ETS and ARIMA models using “opera.”